The different data
Each week, Argonautica delivers a series of data produced by different techniques, institutes, satellites... These data (maps for most) show the values of different physical, chemical or biological parameters which are representative of the ocean and how it works.
- For more information see:
- What the maps show
- Locations
- Data sources used by Argonautica to plot the maps
Depending on the zone, the colour scale for each parameter plotted may vary in minimum and maximum (for example, water temperatures at the equator will be higher than when at the Pole, and the use of the same values for minimum and maximum would hide information). The various palettes of colours have been selected according to what they represent (this choice is not an absolute rule as other projects choose different colours for the same parameters); they are however identical from one beacon to another and from one year to another.
What the maps show
The maps correspond to the date at the end of the Argos beacon's weekly trajectory. The previous week's map may possibly correspond more to the beacon's trajectory if the interesting movements were at the beginning of the week.
Bathymetry
Bathymetry is the depth of water (the negative distances to the sea floor relief). Depths are measured in certain spots by oceanographic ships, or calculated using satellite altimetry measurements and ship measurements.
)
)
Mean oceanic topography
) | This refers to the "permanent relief" of the ocean's surface due to the major currents. The mean oceanic topography was calculated using satellite altimetry measurements, gravity measurements by satellite and sea measurements ("in situ"). More on topography (or height) of the ocean |
Ocean topography
This refers to the relief of the oceans' surface due to currents and their variations. For example, we can observe ocean eddies shown as "hollows" (cold eddies) or "bumps" (hot eddies) of this relief. More on topography (or height) of the ocean | ) |
Ocean topography variations
This refers to the variations of the relief of the oceans' surface. For example, we can observe ocean eddies shown as "hollows" (cold eddies) or "bumps" (hot eddies). More on topography (or height) of the ocean | ) |
Geostrophic currents
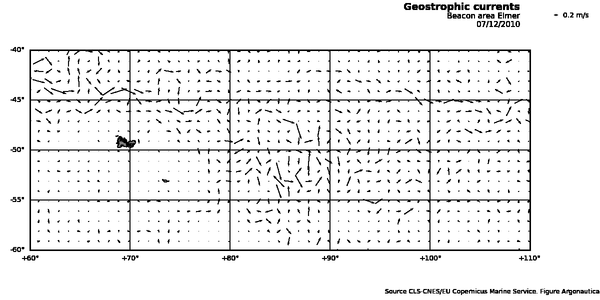 | Geostrophic currents are calculated using the topology of the ocean's surface (from altimetry measurements): the steeper the slopes, the stronger the currents will be. Those currents are perpendicular to the slopes. More information on currents |
Surface currents
Surface currents are calculated using either the geostrophic currents and ocean surface winds, or oceanic forecast models such as Mercator.
More information on currents
)
)
Sea surface temperature
Surface temperature can be measured by buoys at sea, by satellites or calculated using oceanic forecast models such as Mercator.
More information on sea surface temperature
)
)
Salinity
) | The concentration of salts (in the plural, since we are dealing not only with "table" salt, alias sodium chloride but also various dissolved minerals; even though the former accounts for most of the salt content) in sea water is an important piece of information: the more salt there is, the denser the water will be and this plays an important role in its circulation. Salinity can be measured by buoys at sea, derived from other measurements or calculated using oceanic forecast models such as Mercator. Today, the SMOS (ESA) satellite can measure it directly. More information on salinity |
Surface winds
Winds not only make the buoys move, they also influence the surface currents. They can be measured using instruments called "scatterometers" carried by satellites, or calculated using meteorological forecast models such as those at Météo France.
More information on surface wind
Wave heights
Waves are among the phenomena the most feared by sailors. They can be measured using instruments carried by satellites, or calculated using meteorological forecast models such as those at Météo France.
More information on wave heights
Ocean colour
Phytoplankton is the "plant" part of plankton (live micro-organisms in the ocean) that makes up the first link in the marine food-chain. Measuring the amount of phytoplankton is essential for understanding marine ecosystems. The presence of phytoplankton modifies the colour of sea water because it contains chlorophyll, the pigment which makes the Earth's vegetation green. These instruments are sensitive to weather conditions: when the sky is overcast, maps have white zones which indicate where measurements are blocked by clouds. More information on ocean colour and chlorophyll measurements | ) |
Concentration of ice, thickness of ice, ice drift
Sea ice (or ice floe) can be characterised using different data. The Mercator model calculates the following:
- concentration of ice: from 0 to 1 (in reality, from 0 to 100%) of the surface covered by ice.
- thickness of ice: the thickness of ice is basically an indicator of its age. The thicker it is, the longer ago it was formed. A thickness of 4 to 5 m can be found in the Arctic where it lasts for several years. On the other hand, in Antarctica, where it melts and re-forms each year, it is never more than 2 m thick.
- ice drift: ice in the ocean moves according to currents and winds. it is this movement that we are talking about when we say ice "drift".
These amounts can also be measured by satellite (the concentration and drift through different techniques, or thickness using the Cryosat (ESA) altimetry satellite), or calculated from measurements.
More information on sea ice
)
)
)
The locations
Argonautica simplifies and homogenises the Argos files it receives: among all the data provided by Argos, only a small amount is maintained; all data are presented in an identical format.
Weekly positions are provided beacon by beacon in table format. A text file, as displayed on the web page, can be downloaded with the table.
The name of weekly location files incorporates the date at the end of each weekly period. For example, location positions in the aronnax_2004-11-30.txt file start on 24 November 2004 and end on 30 November 2004 inclusive. Another file is available and contains all of the locations since the Argonautica tracking of the beacon began.
As maps, they are provided with two colors for the trajectory: red for the past week, blue for older locations (and similarly on Google Earth, two colors are used)
More information on locations
Data sources
Argos
The Argos instruments carried on different satellites locate beacons on the Earth's surface (including ocean surfaces)
More information on Argos
More information on oceanographic buoys and beacons located by Argos: :
The Argo network of drifting floats
Altimetry satellites
Altimeters are radar payloads on satellites that measure the height of the ocean.
Today, several operational satellites are used to calculate the maps plotted for Argonautica.
More information on altimeters
Mercator
Mercator Océan develops and operates oceanic forecasting models and distributes the forecasts.
Until October 2005, only data for the North and Tropical Atlantic and the Mediterranean were available. Since then, data are available for all of the oceans (see the Mercator Océan site).
Plus sur :
Mercator (Mercator Océan web site)
Ocean models
Satellites that measure sea surface temperatures
Sea surface temperature is estimated by satellites using the radiance emitted by the ocean's surface; either in infrared wavelengths (very high resolution measurements but sensitive to cloud-cover) or in microwaves (images have lower resolution but are less sensitive to cloud-cover).
More information on sea surface temperature measurements by satellite:
Infrared radiometers
Microwave radiometers
Ocean colour
By observing the oceans with instruments that "see" in the green and blue wave lengths, we can determine the concentration of phytoplankton in the water (actually, the concentration of chlorophyll). These instruments are sensitive to weather: when the sky was overcast, the maps have white zones showing where measurements were blocked by clouds.
More information on the ocean colour and its measurement by satellite:
Optical radiometers
Scatterometers
Scatterometers are radars on satellites that measure ocean surface wind.