A buoy "moves straight ahead"
Observation:
A drifting buoy follows a roughly straight course over several weeks (especially close to Antarctica).
Hypothesis:
The buoy is following a current (notably, the Antarctic Circumpolar Current).
Steps:
Superimpose the maps of the buoy's position on other maps available for the same date.
On the ocean topography maps,,
the buoy's trajectory roughly follows one of the contour lines on the map. The buoy (more or less) follows the meandering contour line.


Carioca's trajectory (2006) in blue and red on different dates, superimposed on the corresponding dynamic topography maps (click on the images to enlarge them). This buoy very closely follows the Antarctic Circumpolar Current (except for a few small deviations). This is all the easier to see because most of the time it moves along a contour line corresponding to a clear colour change on the map.
Watch the animation here (2.55 Mb or 2.11 Mb)
Like Carioca (2006), Julius (2004-2005) also followed the Antarctic Circumpolar Current but further East, less clearly and for a shorter period of time.

Julius' trajectory (2004-2005) in blue and red on 22 March 2005, superimposed on the corresponding dynamic topography map (click on the image to enlarge it). The buoy follows the Antarctic Circumpolar Current except for a few deviations.
Geostrophic current vector maps
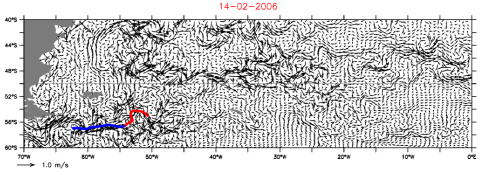
These vectors are proportional to the dynamic topography gradient. Conclusions that can be drawn are similar to those obtained with the dynamic topography map, showing a trajectory that is mostly oriented towards the longest arrows.

Julius' trajectory (2004-2005) in blue and red on 14 February 2006, superimposed on the corresponding geostrophic current map (click on the image to enlarge it). The largest arrows indicate the strongest current. This buoy follows the Antarctic Circumpolar Current (except for a few small deviations).
Mercator surface current maps
On these maps showing the current's velocity (modulus), the buoy's trajectory corresponds to slightly darker blue "veins" of current. In terms of velocity vectors, the trajectory is mostly oriented towards the longest arrows (highest velocities).


Carioca's trajectory (2006) in blue and red on different dates, superimposed on the corresponding Mercator surface current maps (click on the images to enlarge them). At times, the buoy's trajectory lies within the strongest "veins" of current.
Watch the animation here (2.95 Mb or 2.36 Mb)
On surface temperature maps, this type of ocean feature may also appear.


Carioca's trajectory (2006) in blue and red on different dates, superimposed on the corresponding satellite-observed temperature maps (click on the images to enlarge them).
Watch the animation here (2.17 Mb or 1.24 Mb)
On salinity maps, major currents are not systematically visible.

Carioca's trajectory (2006) in blue and red, and Mercator salinity maps on 19 September 2006.
On water colour maps, major currents are hardly visible. Furthermore, measurements cannot be taken when there is significant cloud cover — which is often the case in the region of the Antarctic Circumpolar Current, nor when it's night (close to Antarctica during the Southern Hemisphere winter, it can be most of the time)

Carioca's trajectory (2006) in blue and red, and water colour map on 25 July 2006. The white area is due to cloud cover.
Other examples
- Aviso web site: Applications, Altimetry and buoys (in particular animation at the middle for buoys following the Antarctic Circumpolar Current)
- Aviso web site: Image of the Month, February 2003, Ocean currents (Maps of the major currents as seen on mean ocean topography)
- Aviso web site: Applications, Currents around the world

