Animating maps
Argonautica provides a wealth of different information. In many cases, it is beneficial to compare them by superimposing the various maps available on others, including those showing positioning data. By viewing maps successively (i.e. creating an animation sequence), either on their own or superimposed on others, it is also possible to highlight oceanographic phenomena and explain a buoy or an animal's movements.
- Animated Gif or Video software
E.g. GifAnimator, VideoDub (free of charge)
These programs allow you to animate a series of numbered/ordered images. Some work with dates (GifAnimator), while others require a simple number (VideoDub). The latter has the advantage of allowing you to save the video in formats such as mpeg or avi. However, for all these software, you must prepare the images beforehand (including having superimposed the maps that interest you: see Superimposing maps)Watch the tutorial (in French)
- Presentation software
Suitable software such as OpenOffice Impress is free of charge (commercial equivalents: PowerPoint etc.)
These programs have a "slideshow" mode which is similar to animation. It is not, however, the fastest or the most practical method.Watch the tutorial (in French)
- via Google Earth
Google Earth can read '.kml' and '.kmz' files, the difference being that one consists only of text, whereas the other also contains images compiled in an archive file. It is possible to create a series of images in a .kml file, and thus animate them.
Watch the tutorial (in French)
To create an animation from Argonautica's Google Earth maps:
- Select a beacon (e.g. Aqua, which worked from 27 November 2012 through to 5 March 2013)
- In a simple text editor such as NotePad or BlocNote (avoid Word or word-processing software), write
<?xml version="1.0" encoding="UTF-8"?>
and, further down
<kml xmlns="http://earth.google.com/kml/2.1">
<Document><name><![CDATA[Aqua]]></name>
<open>1</open>
<visibility>1</visibility>
<flyToView>0</flyToView><Document> </xml>
Between these two groups of lines, it is necessary to define an expression of the form below, for each week during which the selected transmitter/buoy was working:
<NetworkLink> opening of the "internet link" instruction
For Aqua's 15-week period of operation, the following result is generated: text version or on Google Earth directly
<name>Aqua 2012-11-27</name> name (optional, but useful)
<TimeSpan> opening of the "period" instruction
<begin>2012-11-20</begin> beginning date
<end>2012-11-27</end> end date
</TimeSpan> closing of the "period" instruction
<visibility>1</visibility> default will be that files are visible (0 otherwise)
<Link> opening of the "link address" instruction
<href>aqua_2012-11-27_fr.kmz</href> file address
</Link> closing of the "link address" instruction
</NetworkLink> closing of the "internet link" instruction
<refreshVisibility>1</refreshVisibility> display is refreshed between two maps
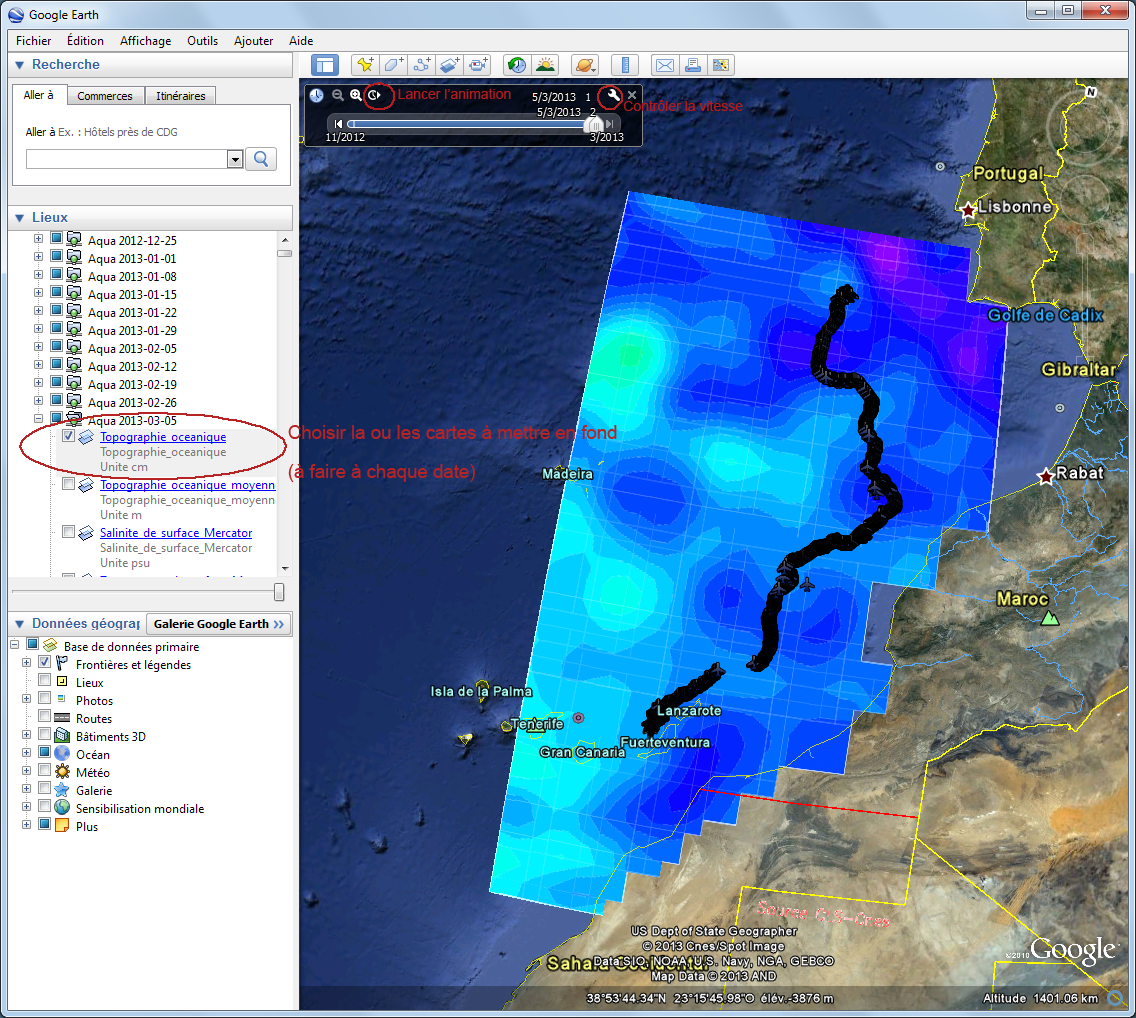
To watch the animation, follow these steps:- At the top left of the globe, there is a small "scroll bar" that runs the animation. There is also a tool at the top right that controls the speed, from "slow" to "fast".
- To create an animation with oceanography maps, follow the instructions above (N.B. each week), selecting a colour map and/or a vector/contour map.
- N.B. it is sometimes necessary to run the animation once or twice to allow the files to load and the animation to be complete.