Practical instructions for using Argonautica data
Google Earth
You can display each series of maps using Google Earth. Available at the at the top of the page, this feature allows simple superimposition of different maps, provided that both maps are not completely "coloured" and that the coloured one is not on top (an ocean currents map with arrows which is on top of a coloured topographic map works very well, but the opposite is not true).
See quick start guide for using Google Earth with Argonautica.
Dates and zones
Maps are produced in advance for predefined zones; they correspond to the zones in which we expect the beacon to be moving, according to habits (for animals) or prevailing winds and currents (for oceanography beacons).
The animal or oceanographic beacon may sometimes have an unexpected trajectory (notably an oceanographic beacon swept along in a current, or an albatross flying around the world whereas others have remained around the same island) or last a very long time. When this happens the locations may be off the maps provided. This requires reprocessing to ensure consistency in the map series (in this case, all the maps, even the initial ones, are reproduced for the new zone). Such reprocessing is not necessarily done immediately when a beacon goes off the map.
Maps are plotted two days after the last location day(since data are not always immediately available).
Two modes of use
Real time
The Argonautica site is updated every Thursday with location data going as far back as the previous Tuesday and maps corresponding to locations for two weeks before. Hence, although you cannot track the day-to-day movement of an animal or buoy, you can track it from week to week.
The Archives
For several years now, Argonautica has undertaken an annual campaign. Data (locations and maps) for all the previous years are available on the site. They can be used in the same way as the current year's data but with a greater choice of examples, and in some cases some previous analytical results.
Some particularly interesting examples of past trajectories are available in the "case studies" section on this site.
Three types of data
From Argos beacons: "on the spot" measurements
Whether on an animal or a buoy, Argos beacons are what we call "in situ" sensors; in other words, they take geo-located, time-tagged measurements on the spot. Being on site is the only way to measure certain parameters in the ocean, particularly in the depths of the ocean. Moreover, it is an excellent tool to help us understand animals, especially marine animals that are difficult to observe on a continuous basis.
From satellites: seeing from far, seeing globally
The advantage of satellites is that they take measurements from very high up, and can therefore "see" all or a large part of the Earth. Earth observation satellites, other than some weather satellites, are usually moving satellites, in other words they orbit around the Earth at an altitude which means that the Earth rotates at a different speed below them. Consequently, they observe almost the entire surface of the planet. This being said, they only observe the surface of the Earth: all satellites use electromagnetic waves to observe; just like light, these waves penetrate little or none of the ocean's depth.
The models: the ocean can be forecast by computation, just as for the weather
Models can be local, regional or global. They calculate the ocean's physics, chemistry and/or biology at the surface and/or below the surface. They allow us to forecast changes in the ocean's situation (like a weather forecast, with the currents replacing the winds). They use satellite or in situ measurements to approximate the reality on the ground (just like weather forecasting services, which use weather stations and satellites).
Plotting the locations
Locations can be plotted on a map (an empty map is provided for this purpose for each beacon, even though any other map covering the zone may be used).
The on-site maps
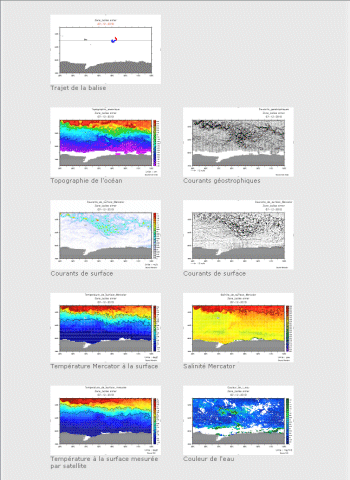
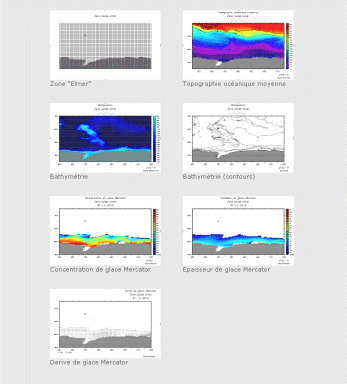
Argonautica provides some maps each week. The maps are available on the site; they are displayed as thumbnails so that a large number of them can be seen at a glance. By clicking on them, they can be enlarged and seen side-by-side (even if they overlap each other on your screen, they are opened in different windows). You can also download all of the maps for a given date and beacon by clicking on "Download all images"; then image processing software (e.g. "Photoshop") can be used to superimpose them. Or you can use slideshow software (e.g. "PowerPoint") to display them as slides. /p>


